This the exact method used by Gonzalo García Pelayo and his family, to spot biased roulette wheels and win millions from Brick and Mortar Casinos. Unfortunately it can not be applied to RNG online roulette, but it can be applied in online casinos offering live dealer roulette.
How to spot biased wheels
In order to spot a possible wheel bias, since we don’t own them to make physical measures, we have to recur to statistical analysis of its behavior, and here we really have to use Mathematics.
It is necessary to investigate if a roulette wheel does have a behavior which deviates from the expected for a perfect machine, and in order to achieve this we have to know first how would this machine work perfectly. For this purpose I created the “positive” concept. If after 36 spins a number comes out once, there won’t be any positive nor negative. If it comes out twice, we have a positive (+1), if it appears three times, we have two positives (+2), etc. If it doesn’t show at all, then we have a negative (-1). We base this on the accounting for the actual financial payout, not its real probability which is to come out once every 37 spins.
How many positives a number can have after a certain amount of spins at a perfectly balanced wheel? Or rephrasing the same –and this question is valid for the game and many other aspects-: What are the limits of pure random luck?
I built a computer software which emulated a perfectly random game, this means, without any bias, and I ran millions of spins on it. I deducted I’d need at least 2,000 separated trials per each numerical segment considered, being these segments going in an augmentation at a rate of 100-spin intervals. For instance, for the 1,000 spins segment, I had to process 2 million samples, and likewise for every new block of numbers, there was the need to execute as many tests as the result of the multiplication of said block by 2,000 needed trials.


Biased wheel data analysis
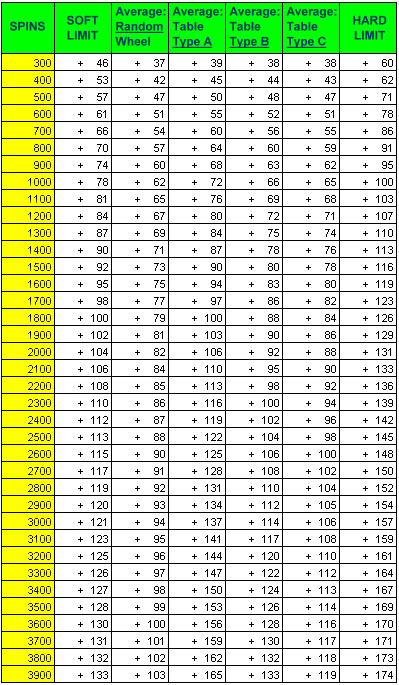
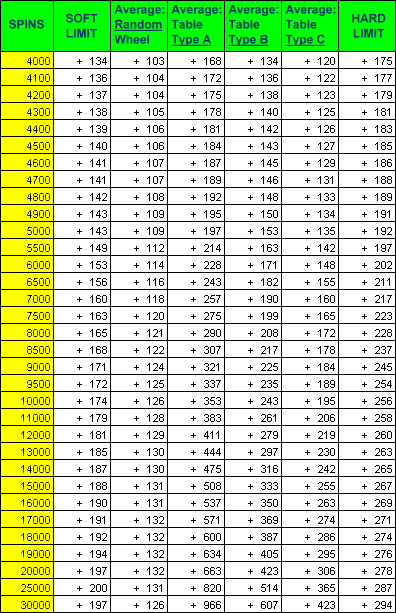
Let’s analyze the tables above with four different amounts of spin samples.
If we have to use a 300-spin length sampling, we can observe the sum of “positives” (times above the expected considering 36-spin cycles) for numbers is around +37. Let’s turn it the other way around; if there have been 300 spins, each numbers has to have been spun 300/36 = 8.33 in order to be breaking even. This means those which have been spun 8 times are losing a little, and those which have showed 9 times are winning something. If a number has appeared 14 times it is clear it has 14-8.33 = 5.67 which we will express in an abbreviated form like +5. Let’s suppose the exact same situation has occurred for 6 other numbers also, they all will make a total sum of 5.67 + 5.67 + 5.67 + 5.67 + 5.67 + 5.67+ 5.67 = 39.69. as no other number has been spun over 9 times, then we say the amount of total positives at this table at 300 spins is +39. We can declare the table is a bit above the “randomly expected “ (+37) yet in addition it is far from the “soft limit” which is located at +46.
What is the “Soft Limit”? It is the maximum reached by 95% of those 2,000 trials. Only 5% of trials went over this amount of positives, then we can affirm it is hard to pass the soft limit, as this only happens at this 5% of instances by pure random luck at an wheel without any bias.
What is the “Hard Limit”? It is the one which has only happened once at these 2,000 trials. Therefore it is something belonging to a probability factor of 1 in 2,000, a tiny 0.05% to be spun by pure “random luck”, which finds here the limit we were looking for.
Previous example with its 39 positives doesn’t unveil anything about this particular table. Some numbers have appeared more than others but not in a significant enough scenario. If would be significant shall the sum of the positives at this table were +50, which albeit not being one 100% certain, it does places the table past the Soft Limit and makes us think this wheel points to the right direction. The true wonder would, be if its positives get to sum +64, which would clearly state this table as having a very strong tendency, which we can consider like a savings account for us to take the money from. When doing a 300-spin sample I haven’t accounted for such a deviation. We need to collect more spins for statistics, as the best wheel we have found (we call them “Tables type A”) have to go with this amount of spins at a +39 approximately. Please allow me to make a pause in our walk to further explaining what is a “Table type A”.
Different types of statistics Tables
If we have reliable statistics, gathered from what we know is a single table after 5,000 spins, we have to know, by looking up at chart above, that the regular outcome is for total positives to go around +109, if they pass over +143 we can be in front of something interesting, and if they are above +192 we have in presence of an authentic bomb. This happened to our “Tables type A”, which by this time have left behind every doubt, as they have gone past –in average- with their +197, the mythical hard limit. So we have more than 99.95% degree of certainty this particular table has bias, and therefore, the expected is for those deviated numbers to continue their sustained deviation as they have been doing.
Most common wheels we found when scouting, “Tables type B”, were at +153 positives, and the worst ones, “Tables type C”, with some (but very little) bias, were already at +135, still within the boundaries of the Soft Limit.
We started our bias attack when the numbers which have been appearing the most at target Wheel do have passed the Soft Limit. By having 95% certainty of their bias, we thought it was worth risking remaining 5% (only once out of every 20 occasions) having the regular outcome of these attacks being the table “moving forward” and deviating in favor of those numbers while we were betting, till it passed by the “hard limit” which gave us absolute security (no wheel passed this hard limit and went back; unless it is manipulated, there is no way back from it). If the target wheel went back from SOFT limit -as we mentioned, this can happen 1 out of every 20 times-, we simply stopped betting on it and its losses were compensated by the wins obtained from those which have been faithful to their spotted biases.
If we have recorded 10,000 spins from a single table (this record could be at intervals, made at several days, several different sessions, without it being an impediment for going off the table a half-hour to have diner, but we must always be 100% certain they are from the same table, which hasn’t been replaced in any of its elements; reason for which we have to take note of any identifiable physical traits which ensure us proper identification of this particular wheel), with this record we already have a clear definition from what this machine can offer us. Even if its quality for the effect of our attack is reduced (“Table type C”) for the purpose of eligibility it should have gone past “Soft Limit” already (+174) and must be at least at +195. If it doesn’t has reached these numbers, it is better to just forget about what this table has to offer, as there is little to no advantage to be derived from it.
When a random table reaches a 30,000-spin sample, its average and soft limit start to descend and it it expected to continue under this fashion until the point on which, after many spins analyzed, there won’t be any number with “positives” remaining, as house advantage has imposed over all of them and none achieves appearing above the expected when averaged against 1 per every 36 spins, as its actual probability is to make it once per every 37 spins and that “flagstone” has been imposed over them in a definitive way. But is the table has Bias, some number would have been “catapulted” or “rocketed” and they will continue going upwards. Even at a “Table type C” it would have passed above the hardest limit, guaranteeing its advantage, even if a small one. IF the table has any quality and it is a “Table type A”, it sails now at an stratospherically high +966 which is impossible to find at a truly unbiased level wheel which has its “random maximum” (by pure luck) placed at a hard limit of only +294.
They mainly took raw data and check their soft and hard limit to make a decision to bet.You decide for how much sample spins u want to calculate hard and soft limit for? Let’s say we want to calculate it for 500 spins sample.
You employ you computer’s pseudo random number generator to generate a random sequence of numbers from 0 to 36 inclusive 500 times.
So now you have 500 random number sequence.
You repeat this procedure 2000 times (as done by Mr. Pelayo), so now u have 2000 different sequences of 500 random numbers each
Then you calculate true probability for each number using 500/37 or 500/36 (as done by Mr. Pelayo, I still don’t know why would he do that?)
500/37=13.51351351351351
Then you count number of occurrences of each number in you 2000 sequences of 500 numbers each. In each set of 500 random numbers if a number appears more than 13 times it belongs to set of “positives”. You subtract 13.51351351351351 from the occurrence of number and you get +(something) for each such number.
You then add all “positives” of all numbers which have appeared more than 13 times in each set of 500 random numbers and you get a +(something) value for each set.
Repeating above procedure for remaining 1999 sequences. You will have 2000 different +positive values for each set of 500 random numbers.
Now if any positive value or a value greater than it among these 2000 positives appears only 5% of the time in this group , that is your soft limit. If it appears only 0.05% of time , that positive value is your hard limit.
Part 2: Biased wheel Betting method
Part 3: Gonzalo García Pelayo roulette strategy explained and actual data example from Pelayo.
[Spanish version from: Grupojoker.com | Translation: Victor]